Comparisons
Users must switch to the comparison page. Go to the action menu bar and navigate to “File → Perform comparisons from a remote sensing instrument” as seen in Figure 17.
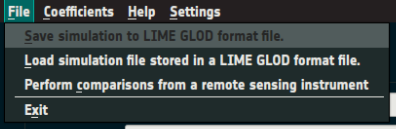
Figure 17: Action menu option to switch to the comparisons page.
Comparison Input
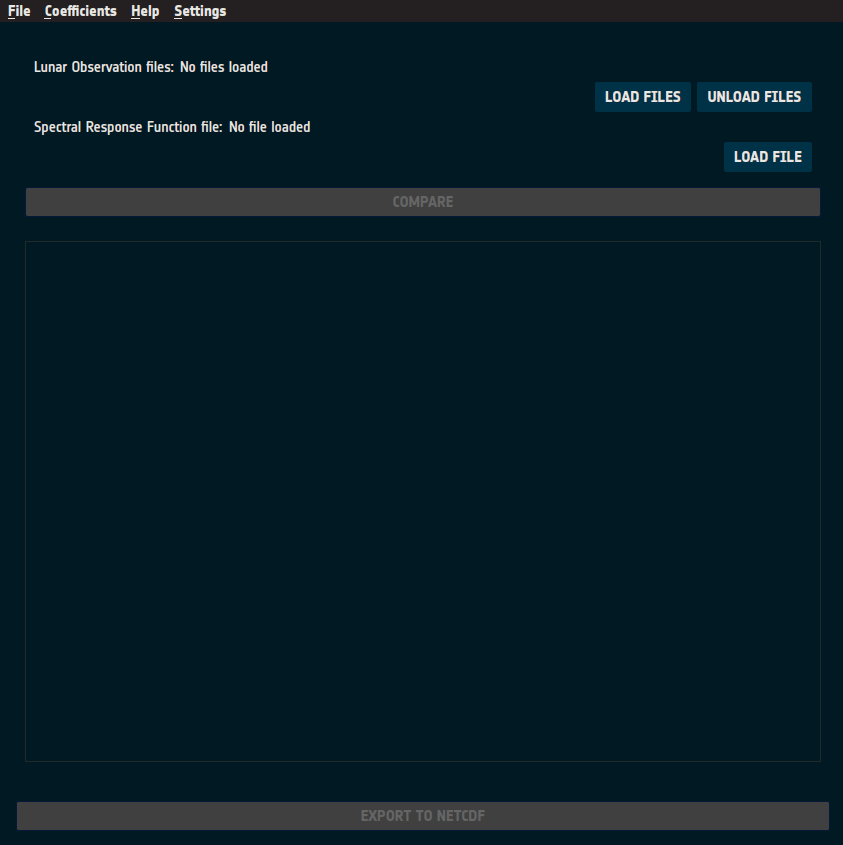
Figure 18: Initial view of the comparison page.
The comparison page (Figure 18) contains the user input fields at the top:
Lunar Observation Files:
Instrument observation netCDF files in GLOD format to be compared.
GLOD formats are explained in the File Formats section.
“LOAD FILES”: Opens a file selection dialog for loading observation files.
“UNLOAD FILES”: Clears all loaded observation files.
SRF File:
SRF netCDF file in GLOD format.
Must contain channels matching those in the observation files.
“LOAD FILE”: Opens a file selection dialog for selecting the SRF file.
Compare Button:
Initiates the comparison processing, displaying a progress indicator (as shown in Figure 19).
This button is enabled once valid observations and an SRF file are loaded.
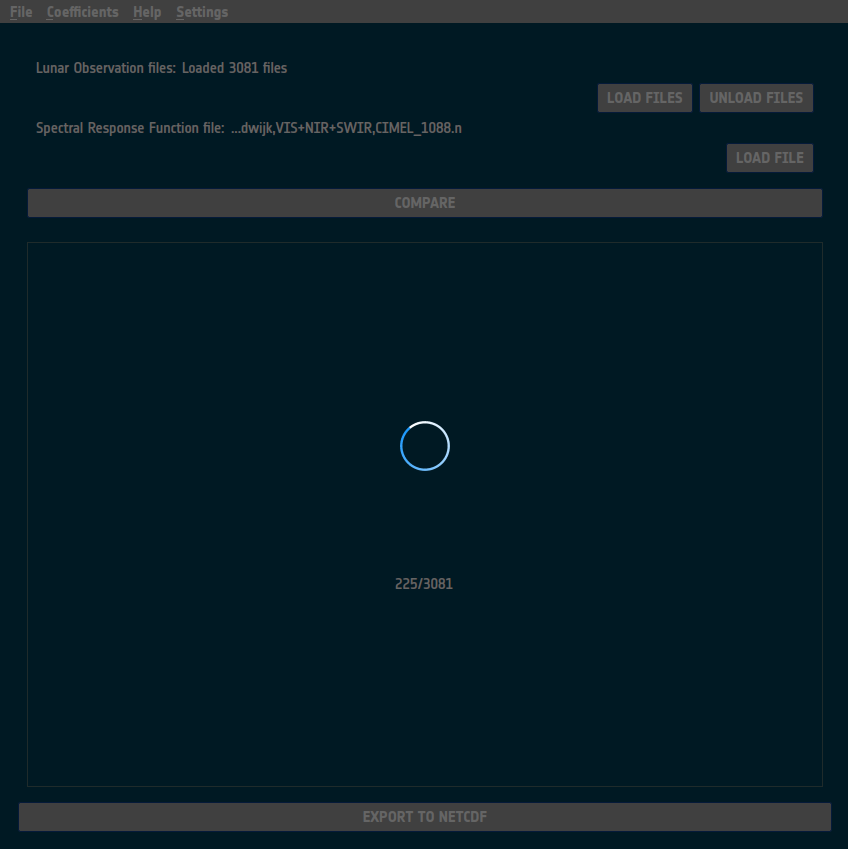
Figure 19: Comparison page processing comparisons.
Comparison Output
Once comparisons are computed, the comparison page presents the results and provides tools for exploring the data, as shown in Figure 20.
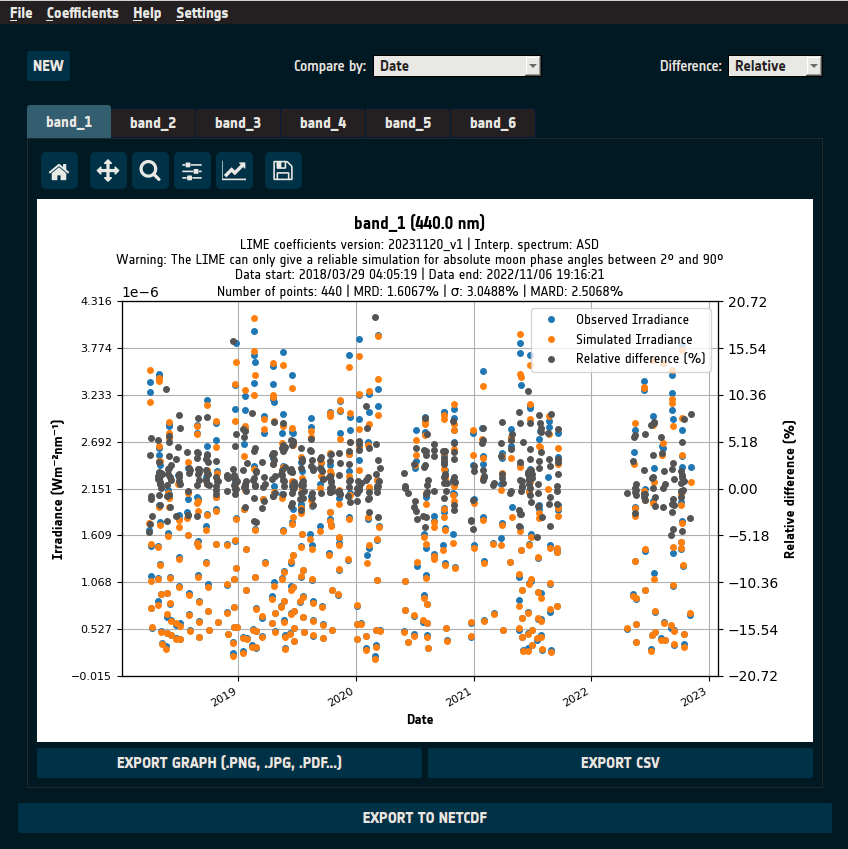
Figure 20: Comparison page after comparisons are computed.
Default View
The instrument’s first-channel irradiance observations (blue) are plotted alongside
LIME simulations (orange) for the same channel.The x-axis represents the comparison variable (default: Date).
The primary y-axis represents irradiance values.
The secondary y-axis (right) represents the relative difference (%) (gray).
User Options
Channel Selection: Switch between instrument channels via the “Channels” tab (above the graphs).
Difference Metric: Adjust the displayed difference via the “Difference” dropdown (top-right), selecting:
Relative difference
Percentage difference
No difference
Comparison Method: Change the comparison basis via the “Comparison by” dropdown (top-center) from Date to:
Moon phase angle
Wavelength, with two visualization options:
Mean-based Comparison: Computes the mean of all observations and simulations for each channel.
Boxplot Visualization: Displays the distribution of values per channel, as explained in Figure 21.
Filter outliers: Iteratively remove data points that deviate by three or more standard deviations from the mean. The process continues automatically until all remaining points fall within the range. To apply it, press the “FILTER $3\sigma$” button.
New Comparison: Click “NEW” (top-left) to clear results and start a new comparison.
A confirmation dialog appears, as shown in Figure 22.
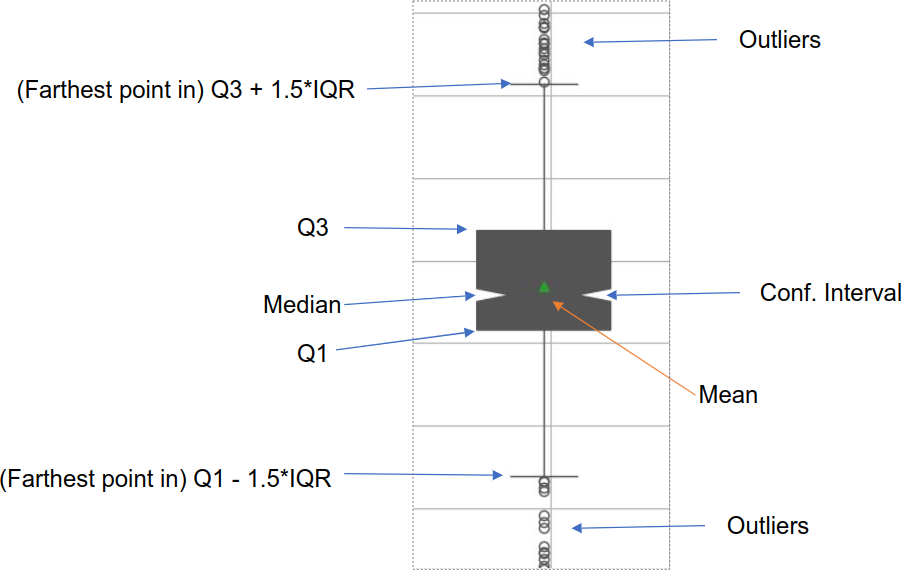
Figure 21: Breakdown of LIME comparison boxplots.
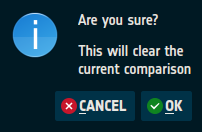
Figure 22: Dialog asking for confirmation after clicking “NEW”
Exporting Data
Graphs can be exported as images (JPG, PNG, PDF, etc.) or CSV files.
The full comparison dataset can be saved as a netCDF file, allowing it to be reloaded in LIME Toolbox for future analysis.
Comparing throught the Command-Line Interface (CLI)
CLI Comparison Input
To perform comparisons via CLI, use the -c or --comparison option along with -f or --srf:
lime -c "path_observation_1 path_observation_2 ... path_observation_n" -f path_srf
Example:
To compare input_1.nc, input_2.nc and input_3.nc, using the spectral response function
defined in srf.nc:
lime -c "input_1.nc input_2.nc input_3.nc" -f srf.nc
Users can also use glob patterns to load multiple files.
For example to compare all .nc files in the files directory:
lime -c "files/*.nc"
CLI Comparison Output
As with simulations, comparison results must be be exported in order to be able to interact
with them. Append the -o or --output option for this.
Graphical Export (Image/PDF)
Specify the image type, comparison variable, difference metric, and file paths for each channel:
-o graph,(pdf|jpg|png|svg),(DT|MPA|BOTH|CHANNEL|CHANNEL_MEAN),(rel|perc|none),comparison_channel_1,comparison_channel_2,...,comparison_channel_n
To simplify, export all channels to a directory using graphd:
-o graphd,(pdf|jpg|png|svg),(DT|MPA|BOTH|CHANNEL|CHANNEL_MEAN),(rel|perc|none),output_directory
Examples:
-o graph,jpg,DT,rel,comparison1.jpg,comparison2.jpg
Using graphd:
-o graphd,jpg,DT,rel,comparison_dir
Data Export (CSV File)
Specify the comparison variable, difference metric, and file paths for each channel:
-o csv,(DT|MPA|BOTH|CHANNEL|CHANNEL_MEAN),(rel|perc|none),comparison_channel_1,comparison_channel_2,...,comparison_channel_n
To export all channels to a directory, use csvd:
-o csvd,(DT|MPA|BOTH|CHANNEL|CHANNEL_MEAN),(rel|perc|none),output_directory
Examples:
-o csv,DT,rel,comparison1.csv,comparison2.csv
Using csvd:
-o csvd,DT,rel,comparison_dir
NetCDF Export
Specify the netCDF file path:
-o nc,output_path
Example:
-o nc,output.nc
CLI Comparison Filters
Users can also apply the $3\sigma$ outlier filter by adding the --filter3sigma flag:
lime -c "files/*.nc" --filter3sigma