Overview
Simulation & Comparison Workflow
LIME Toolbox follows a structured process to compute lunar reflectance and irradiance based on precomputed coefficients and user-defined settings. The computed irradiance can then be compared against real instrument observations. This process is described in (Figure 1).
Summary of the Process
Handle input obtaining LIME variables.
Compute LIME reflectance at CIMEL wavelengths using LIME coefficients.
Interpolate reflectance using ASD or Apollo 16 + Breccia spectrum.
Convert reflectance to irradiance using the selected TSIS-1 SRF instance.
Integrate irradiance over the instrument SRF to compute channel-specific values.
Compare simulated irradiance against real instrument observations.
Visualise and export results.
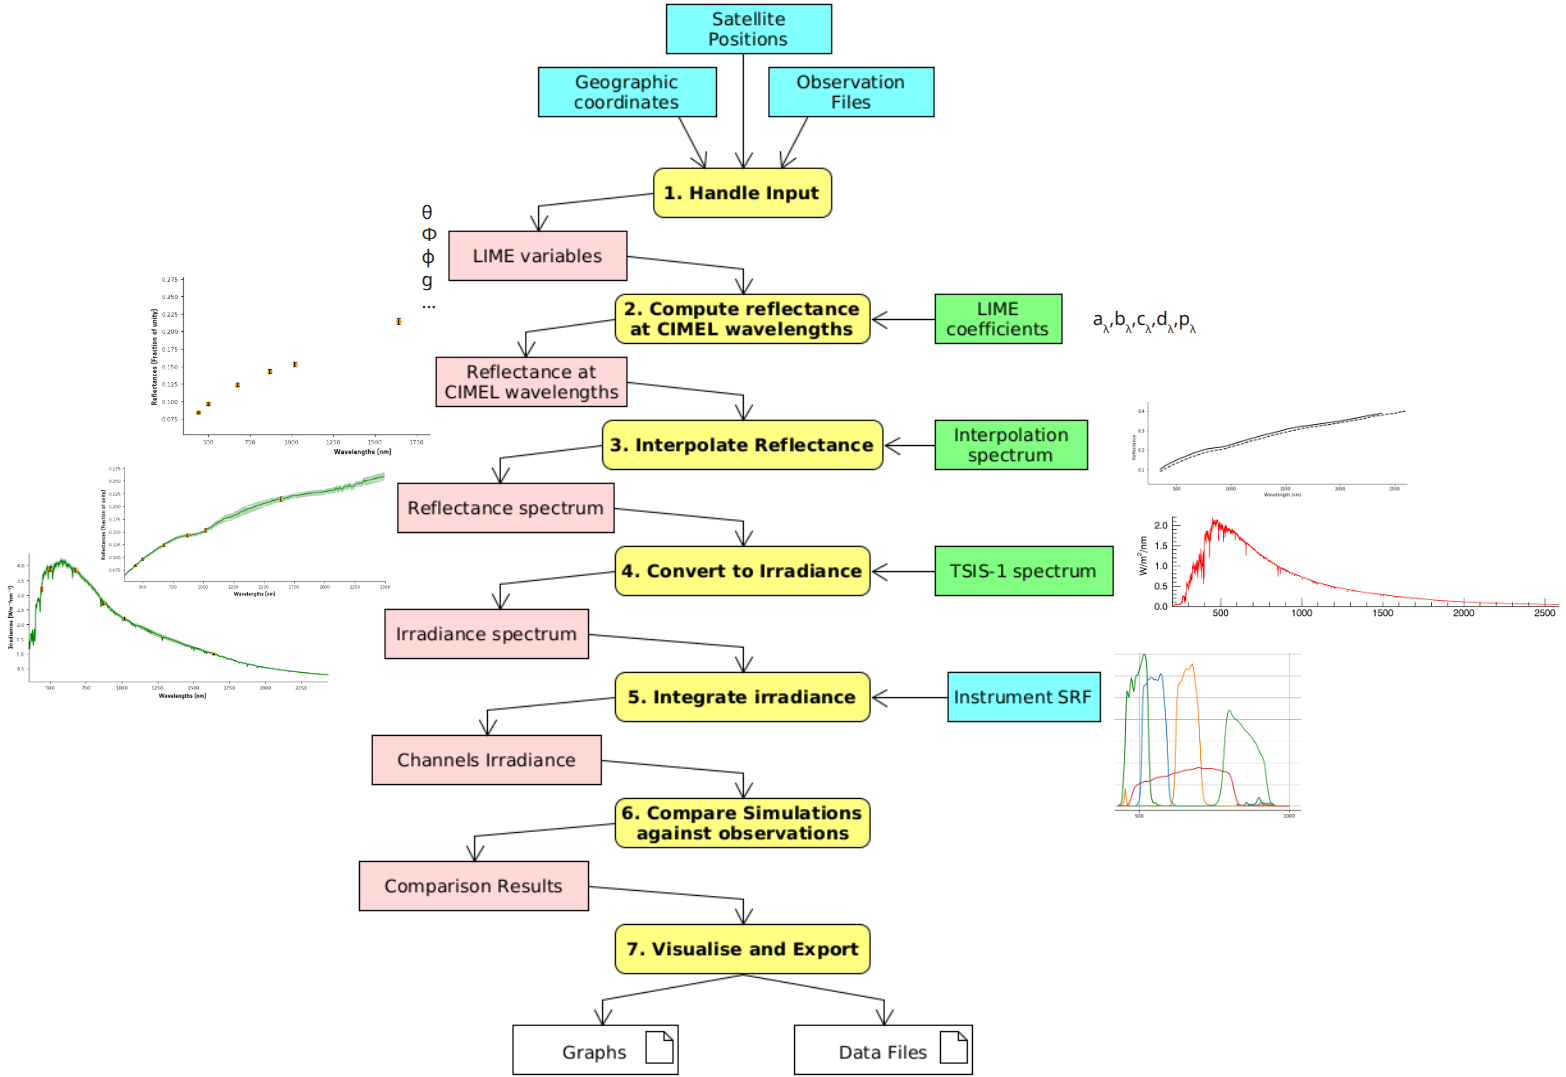
Figure 1: Activity diagram of the Simulation & Comparison Workflow.
1. Input Handling
Before computing simulations or comparisons, LIME Toolbox must extract the necessary input parameters. These include key LIME model variables, such as:
Selenographic latitude and longitude of the observer
Distance between the Sun and the Moon
Distance between the observer and the Moon
Selenographic longitude of the Sun
Moon phase angle
LIME Toolbox retrieves these parameters from one of two sources:
Direct Input – Users can provide geographic, selenographic, or satellite coordinates.
Observation Files – Provide precise geographic coordinates but can also be used with selenographic or satellite-based simulations.
To ensure accuracy, LIME Toolbox computes missing parameters using:
SPICE for orbital and positional data. Used to compute LIME variables from geographic coordinates.
EO-CFI when processing satellite-based observations.
2. Computing LIME for CIMEL Wavelengths
The first step in the simulation is to compute the LIME model for the predefined CIMEL wavelengths.
These computations are based on LIME coefficients.
The result of this step is a set of lunar reflectance values at the specific CIMEL wavelengths.
3. Spectral Interpolation
Since LIME coefficients provide values only for CIMEL wavelengths, the next step is spectral interpolation.
The interpolation uses a reference spectrum, which is selected by the user:
ASD Spectrum (default and preferred choice), derived from Izaña ground-based observations.
Apollo 16 + Breccia Spectrum, a ROLO-based composite spectrum.
Using the selected spectrum, LIME interpolates reflectance values across the entire wavelength range (typically 350–2500 nm).
4. Conversion to Irradiance Using the Solar Spectrum
Once reflectance values are interpolated, LIME converts them into lunar irradiance.
This transformation involves multiplying reflectance by the selected TSIS-1 solar spectrum instance.
The available TSIS-1 Spectral Response Function (SRF) instances include:
ASD SRF (corresponding to the ASD spectroradiometer).
Gaussian SRF (1nm spectral sampling, 3nm resolution).
Triangular SRF (1nm spectral sampling, 1nm resolution).
The selected TSIS-1 SRF determines how much sunlight radiance reaches the Moon at each wavelength.
5. Spectral Response Function (SRF) Integration
The computed irradiance values must be adjusted based on the instrument response.
Each instrument has a Spectral Response Function (SRF) that weights different wavelengths differently.
LIME integrates the simulated irradiance over the instrument SRF, producing an integrated irradiance value per spectral channel.
6. Compare Simulations against Observations
Once the simulated irradiance values per channel have been computed, they can be compared against real instrument observations.
6.1. Align Simulations and Observations
LIME matches timestamps between observations and simulations.
Observed irradiance is compared to the simulated values.
If needed, LIME recomputes distances and normalisation factors.
6.2. Computing Comparison Metrics
Once observations and simulations are aligned, LIME computes comparison metrics:
Relative Difference (%):
100 * ((irr_obs - irr_sim) / irr_sim)Percentage Difference (%):
100 * abs(irr_sim - irr_obs) / ((irr_sim + irr_obs) / 2)Statistical Metrics per channel:
Mean Relative Difference (MRD)
Mean Absolute Relative Difference (MARD)
Mean Percentage Difference (MPD)
Standard Deviation of MRD
Number of Observations per Channel
7. Visualisation and Data Export
Once simulations and comparisons are computed, users can:
Visualise Data:
Time-series plots of irradiance and difference.
Boxplots for spectral variability.
Comparison graphs based on:
Timestamp
Moon Phase Angle
Wavelength
Export Results:
Graphs (PNG, JPG, PDF).
Raw Data (CSV, NetCDF for future reloading).
Polarisation Computation
While LIME Toolbox primarily computes reflectance and irradiance, it can also estimate polarisation using precomputed polarisation coefficients.
Degree of Lunar Polarisation (DoLP) and Angle of Linear Polarisation (AoLP) are derived using LIME polarisation coefficients.
Polarisation calculations follow the same interpolation process but do not influence irradiance computation.
The polarisation interpolation spectrum is fixed (users cannot select it).
Polarisation results are computed separately and are available in dedicated output files.